
Even if a claims operations manager opens five different dashboards on a Monday morning, they will still have no idea why the files are accumulating in the queue. The cycle time appears normal, and so does the loss ratio; yet, adjusters are working late, claimants are calling twice as often, and the reopen rate continues to rise each quarter.
Data is usually not the issue; most claims teams already have a large amount of it stored in a system that no one opens except at the end of each month. The real problem lies in monitoring the wrong claims management KPIs or in keeping an eye on the correct ones without linking them to what is actually going on in the claim file. The following guide looks at seven claims management KPIs, which provide an operations leader with a true insight into speed, cost, accuracy, and claimant experience, and explain how to calculate each one and shows where in-house teams typically fall short of the performance delivered by a specialized claims processing partner.
What is claims management, and why are these KPIs important?
The insurance operations function known as claims management is in charge of the entire lifecycle of a claim, covering all the stages from the initial intake through to investigation, adjudication, payment, and finally the closure of the file, as well as carrying out the staffing, coordinating with vendors, ensuring quality control, and producing the necessary reports in order to keep the process running on a large scale.
Techsurance makes the same distinction when it comes to claims processing and claims management: processing involves progressing a single claim through the workflow, whereas management refers to the broader function, which includes service levels, cost control, staffing, and the entire claim portfolio.
It is important to make this distinction since claims management is at the heart of two figures that every insurance company keeps a close eye on: the loss ratio and policyholder retention. If the claims management process is slow, inconsistent, or costly, both of these are damaged, usually in a quiet way, one delayed claim at a time, until the damage finally appears in a quarterly report. By monitoring the appropriate claims management KPIs, the lagging indication can be transformed into one that an operations manager can take action on before it affects the loss ratio.
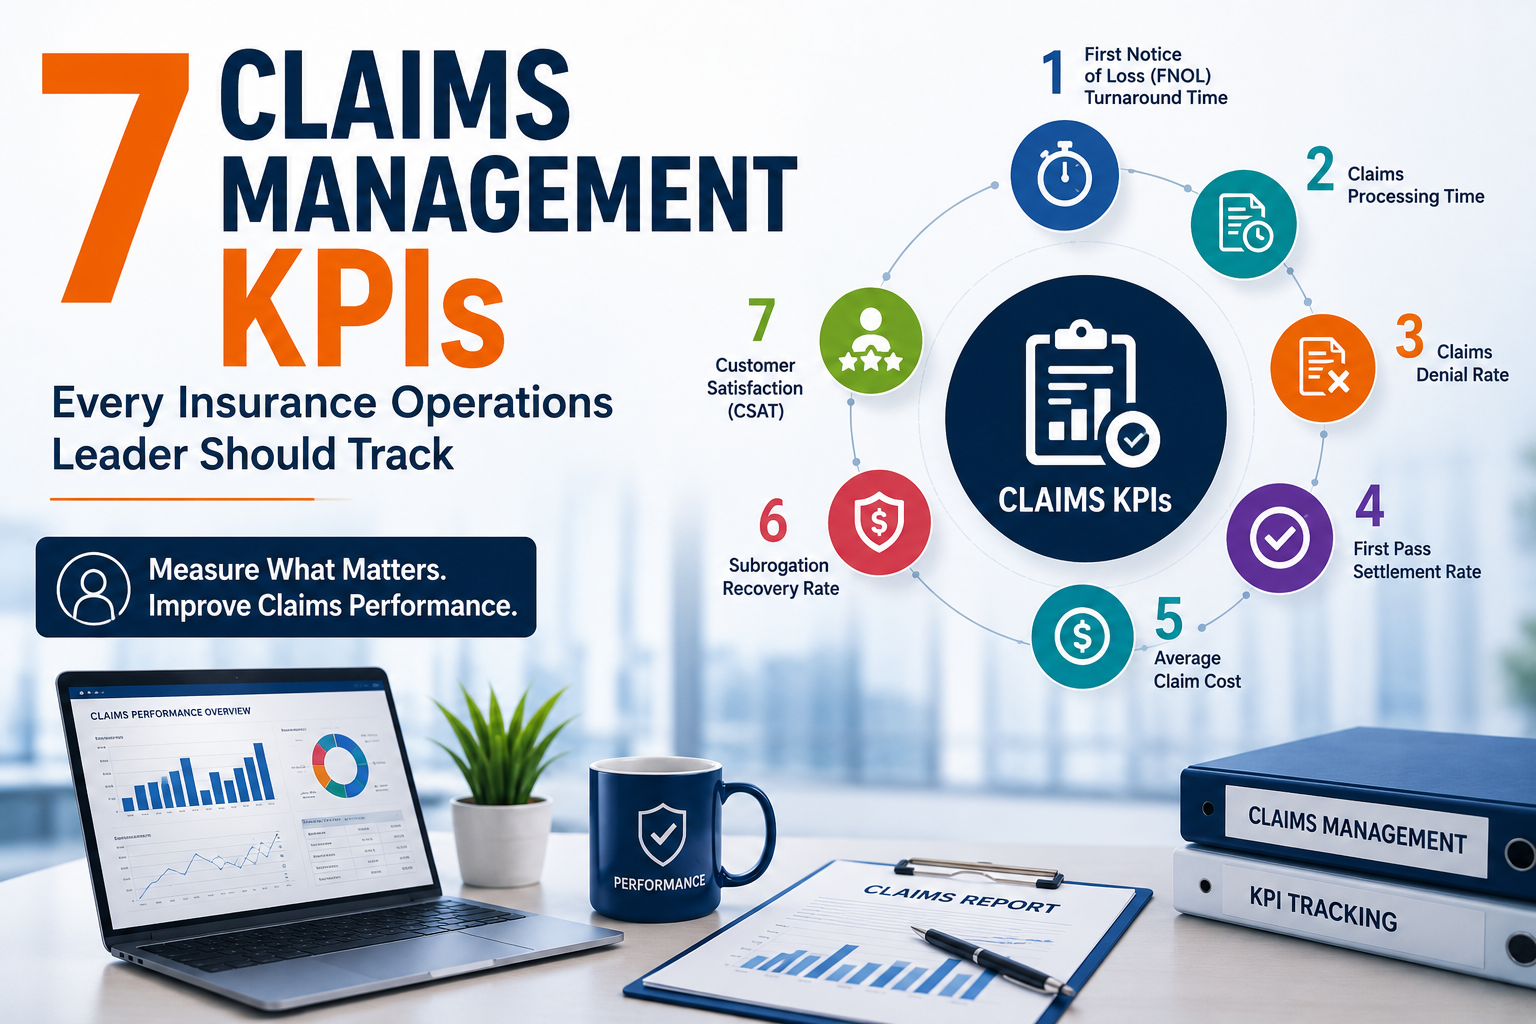
The 7 Claims Management KPIs to Track
1. Claims Cycle Time
Formula: Date of claim closure minus date of claim intake, averaged across a claim segment.
Cycle time is the most closely watched figure in claims management for a very good reason: it has an impact on cost because open files involve reserves and the risk of having to reopen them, and it also affects customer satisfaction since claimants generally assess an insurer on how long it takes to reach a decision. In JD Power’s 2025 U.S. Auto Claims Satisfaction Study, the average repair cycle time for repairable vehicles fell to 19.3 days, a decrease from 22.3 days the previous year, and this improvement alone caused the satisfaction scores to rise by nine points.
Measure cycle time according to claim type and complexity rather than using a single averaged figure, since one average number masks the fact that a simple property claim and a litigated liability claim are almost entirely different in terms of operation.
2. First Contact and Acknowledgment Turnaround
Formula: Time from claim intake to the claimant’s first substantive contact with an adjuster or claims representative.
The KPI picks up a kind of failure that cycle time completely overlooks: a claim can be resolved within a reasonable time frame and yet still leave the claimant frustrated if no one has contacted them in the first four days. First contact turnaround acts as an early warning sign, since when it is delayed, the rest of the file tends to follow, as a delay in the first contact generally indicates that documentation has been missed, the next steps are unclear, and there are repeated inbound calls that take up adjuster time.
3. Claims Leakage Rate
Formula: (Actual claim payout minus the correct payout based on policy terms and assessment) divided by total claim payouts.
Claims leakage looks at where claim payments go wrong. It includes overpayments, underpayments, and claims that were paid even though they did not meet the required terms. Measuring this KPI is not as simple as looking at regular claims reports because the issue often requires a deeper review. Insurers typically examine a sample of claims and compare the payments against policy wording, coverage details, and available documentation. When leakage is not monitored regularly, insurers may only notice the problem months later through broader portfolio reviews.
4. Claim Reopen Rate
Formula: Number of claims reopened after closure, divided by total claims closed in the same period.
A high rate of reopens usually indicates a problem with the quality of the decision rather than one with the speed. Files are closed before the documentation is complete, or an adjuster fails to notice a coverage nuance due to pressure from volume. It is worthwhile monitoring the reopen rate together with the first-pass resolution rate since a claim that is settled correctly the first time hardly ever returns.
5. Cost Per Claim
Formula: Total claims handling expense (adjuster time, vendor fees, administrative overhead) divided by the number of claims processed.
The cost per claim is the measure that links claims management to the bottom line. An example from Deloitte’s collaboration with a large property and casualty insurer shows how significant the improvements can be when this metric is addressed: after reconstructing its auto claims process, the insurer reduced the cycle times by three days for total loss claims and eliminated expenses amounting to 40 million dollars. While it is unlikely that many teams will achieve results of that magnitude from a single project, this case demonstrates how directly cost per claim is affected by process discipline.
6. Claimant Satisfaction Score
Formula: Post-claim survey score (CSAT, NPS, or a custom scale), tracked by claim outcome and adjuster.
The figure obtained from satisfaction surveys has very little value when taken as a single average for the whole company. It should be broken down by type of claim, outcome (whether it is approved, denied, or only partially approved), and by channel, since a claim that is denied will almost always receive a lower score than one that is approved even if the handling of the claim was good. The appropriate comparison to make is between the satisfaction score of a denied claim and that of other denied claims, not with the overall average.
7. Straight-Through Processing Rate
Formula: Number of claims resolved without manual intervention, divided by total claims received.
The STP rate indicates the proportion of claim volume that passes through the automated rules, validation, and payout process without any intervention from an adjuster. It is important for claims management since it provides a direct indication of capacity. If a claims team has a high STP rate when dealing with low-complexity claims, then it can assign its adjusters to the cases that actually require judgment, rather than having to divide their attention between routine and complex claims equally.
| KPI | Formula | What It Signals |
| Claims Cycle Time | Closure date minus intake date | Speed and reserve exposure |
| First Contact Turnaround | Time to first adjuster contact | Early claimant experience |
| Claims Leakage Rate | Payout variance ÷ total payouts | Accuracy and financial control |
| Claim Reopen Rate | Reopened claims ÷ closed claims | Decision quality |
| Cost Per Claim | Handling expense ÷ claims processed | Operational efficiency |
| Claimant Satisfaction Score | Survey score by outcome | Retention risk |
| Straight-Through Processing Rate | Automated claims ÷ total claims | Adjuster capacity |
When your team is already stretched very thin and has to keep up with tracking all seven of these items across different types of claims, this is generally a signal that the claims processing workflow itself needs to be supported before any further dashboard can be of assistance. The health claims processing services offered by Techsurance establish the intake, validation, and quality control stage that makes it possible to produce this type of reporting in the first place.
How to Build a Claims Management KPI Dashboard
- Choose between five and seven KPIs, not twenty. If a dashboard attempts to monitor every item on this list together with a dozen additional ones, it will become background noise. Begin with cycle time, the reopen rate, and cost per claim, and then add the other indicators as reporting maturity increases.
- Benchmark before you do so. Combine the auto, property, and liability claims into a single cycle time figure, because the average will mislead any decision based on it.
- Each KPI should have an owner; a metric for which no one is accountable tends to remain on a dashboard without leading to any changes in behaviour.
- Adjust the frequency of reports to correspond with the decision; the cost per claim can be looked at on a monthly or quarterly basis. The time taken to make first contact should be shown on a weekly basis, and at times on a daily basis during periods of high volume.
- Attach a corrective action to each KPI; for example, if the reopen rate goes above its target, there should already be a predetermined next step, such as a QC sample review, not the need to come up with one on the spot.
In-House Claims Teams vs. Insurance Claims Outsourcing: Who Tracks These Better?
Both models are capable of keeping track of the claims management KPIs, the difference typically lying in the amount of bandwidth available and in whether the quality checks are carried out consistently or only when someone decides to run them.
| KPI reporting cadence | Often monthly, tied to existing BI cycles | Weekly or per-SLA, built into the operating model |
| Staffing during volume spikes | Fixed headcount, backlog grows | Scalable capacity without a hiring cycle |
| QC layer | Frequently informal or ad hoc | Maker-checker QC built into the workflow |
| Domain-specific KPIs (leakage, reopen rate) | Tracked when resources allow | Tracked as a core deliverable |
| Data visibility for the insurer | Internal, sometimes siloed by team | Shared dashboards and SLA reporting |
Insurers considering insurance claims outsourcing should ask a prospective partner exactly which claims management KPIs they report on, how often, and what happens when a metric misses a target. A partner that cannot answer specifically is not ready to own part of the claims process.
Common Mistakes When Measuring Claims Management KPIs
- When averaged over the different types of claims, the blended cycle time or the cost per claim number eliminates the exact variations to which the KPI is subject.
- You can have speed without having accuracy; a claims-handling process that is fast will tend to result in high leakage or a high rate of reopens since it is only quick at making errors.
- There was no baseline established prior to a process change. When teams introduce new outsourcing arrangements for claims processing or new software, they often fail to record a clear ‘before’ figure, making it impossible to honestly assess the ‘after’ figure.
- Viewing satisfaction as a single score means that one CSAT figure masks the difference in the experience of claims that are approved and those that are denied.
- Looking at the KPIs without having a corrective loop is flawed; if a metric fails to meet its target each quarter and no follow-up actions are taken, then it is merely an entry in a spreadsheet and not a true management tool.
How Techsurance Supports Claims Management KPI Improvement
Techsurance works inside the claims management function, not around it. The team supports health claims processing, covering intake, eligibility verification, documentation review, and settlement, with maker-checker quality checks built into the workflow rather than added as an afterthought.
For insurers evaluating whether to keep a claims management function fully in-house or bring in operational support, Techsurance’s own guide on claims processing outsourcing lays out the KPIs a partner should already be reporting on: first-pass resolution rate, turnaround by stage, pend rate and pend age, QA accuracy, escalation rate, and reopen rate. Those map directly to the seven claims management KPIs covered above, which is intentional. A partner that cannot report on your KPIs in your own terms is running its own operation next to your claims team, and that gap tends to show up in the numbers within a quarter.
Conclusion
Seven claims management KPIs alone will not transform a claims process. Their real value is that they help identify what is actually going wrong. Instead of simply knowing that “claims are taking too long,” teams can see where the delay is happening, which claims are affected, which stage is slowing things down, and where action is needed. Once the problem is clear, fixing it becomes a much more practical task.
Start with cycle time, reopen rate, and cost per claim if your team is not tracking any of these consistently today. Add leakage rate and STP rate once the first three are stable. If the constraint turns out to be capacity rather than metrics, Techsurance’s insurance claims processing and back-office support is built to extend a claims management team’s reporting and QC discipline without a long hiring cycle. Get in touch with Techsurance to talk through where your claims management KPIs stand today.
FAQs
What should be the first set of claims management KPIs to keep an eye on?
Cycle time, the rate at which claims are reopened, and the cost per claim provide the most straightforward initial overview since they use data on speed, the quality of decisions, and cost, which most claims systems already collect.
What is the difference between claims leakage and claims cost?
The cost per claim refers to the total amount spent in relation to all claims, while leakage is the difference between the amount that a particular claim was actually paid and the amount it should have been paid according to the terms of the policy, regardless of whether that difference represents an overpayment or an underpayment.
What is a good claim reopen rate?
As there is no single standard benchmark, reopen rates differ according to the type of business and the complexity of the claim; the more effective approach is to compare the rate with your own historical data and then look into any increasing trend according to the type of claim.
Does outsourcing claims processing hurt visibility into these KPIs?
Not with a partner that builds reporting into the SLA. A claims processing outsourcing arrangement should give an insurer the same or better KPI visibility than an internal team provides through scheduled reporting and shared dashboards.
How often should claims management KPIs be reviewed?
It depends on the metric. First contact turnaround and pend rate benefit from weekly reviews. Cost per claim, leakage rate, and loss ratio contribution are usually reviewed monthly or quarterly.
Can a small claims team realistically track all seven KPIs?
Yes, but not all at once. Start with three, build the reporting habit, and expand once those are reliable. Trying to track seven KPIs from a standing start usually means none of them get tracked well.
What role does quality assurance play in claims management KPI accuracy?
QA helps make sure KPIs like leakage rate and reopen rate are based on real data, not just estimates. Without a proper sampling-based quality check, a claims team may know exactly how long claims take and what they cost but still have no clear picture of how accurate the work actually is.
